When people think about web analytics often what comes to mind are overrated metrics like:
- Visits (or sessions)
- Pageviews
- Bounce rate
- Visit duration
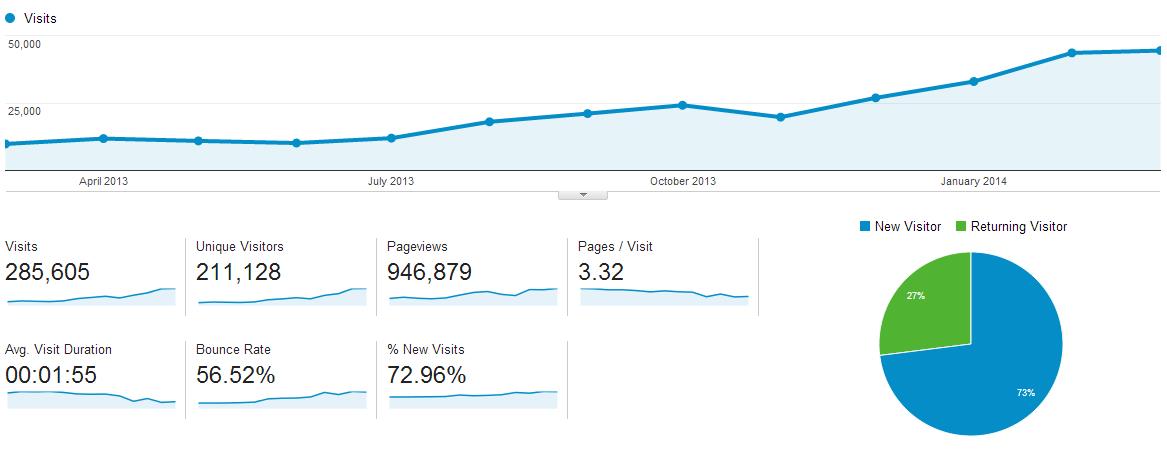
Marketers often review these metrics for all traffic across a website and present reports to management that often look similar to the screenshot below. This looks great, right? How can management not be ecstatic with this wonderful upward trend of traffic?
The problem with the above scenario, however, is two-fold:
- Every website has multiple audiences that are using the site, and the above graph tells us nothing about who these audiences are (other than insight into % of new visitors vs returning visitors).
- Similarly, metrics like visits and pageviews do not help us understand exactly what actions were taken by each audience on the site. For instance, how many users from audience A completed a form submission? It’s impossible to know from these high level metrics and graph.
One of the primary objectives of modern web analytics should be to assess usage by specific audiences while also striving to measure certain outcomes, such as conversion goals and events (specific user actions on the website).
Why Segmenting User Audiences Matter
One recent example regarding the importance of understanding your audiences is in a governmental project currently in progress. It was identified that internal governmental users make up 20% of the traffic on the main website. To not segment this internal audience out separately from the general public would lead to very misleading information and a poor understanding of how the website is actually being used by the average public user.
One great example of the potential differences would be use of technology for browsing the government website. When we look at only internal government traffic, the data shows >90% desktop usage, while in comparison, the general public is only ~74%. Obviously, if this data was combined it would vastly skew our understanding and we may assume mobile/tablet usage is a lot less than in reality.
By only looking at general public traffic by itself, we can see a clear picture that over ~26% of usage is through a mobile or tablet device! Even more enlightening is that mobile/tablet usage saw a >40% increase year over year. Designing websites and apps for mobile and tablet usage is no longer optional for this government website, it is essential and increasingly so.
What was the website built to achieve?
With regard to measuring desired outcomes, it’s essential to shift from the old mindset that simply traffic volume is the most valuable metric. Instead we should define our goals and measure which audience members are completing those goals.
In some cases your goal could be as simple as getting people to reach and consider an important page of content. In other cases the goal could be getting users to complete a very specific outcome, such as registering for an event or subscribing to a newsletter. If your analytics isn’t currently tracking this kind of information, you’re not able to truly understand the value being generated by specific audiences, sources of traffic, or content.
Modern analytics should help managers answer questions like:
• What is the purpose of our website?
• Why do we have this section of content?
• (Or even) Why do we have this one specific page?
• What outcomes are generated by this audience/source/content?
The key is to start thinking about what are the desired outcomes for each unique audience that uses your website. Once you’ve defined this, you can then start reporting on metrics that measure what truly matters – your users accomplishing what your website was built to do.